
October 5, 2026
WooCommerce Hosting Benchmark: 12 Hosting Configurations Tested on 120,000 Orders

When we talk to clients about WooCommerce hosting at Inspry, the conversation quickly becomes more complicated than simply asking which provider has the fastest homepage or the lowest Time to First Byte.
That is partly because once a WooCommerce site gets large enough, the things that affect the business every day aren’t necessarily the things that show up in a typical hosting comparison. A cached product page is important, but so is what happens when someone on the support team searches through 120,000 orders, opens a subscription, edits a product, or spends most of the day working inside wp-admin.
Last year, one of our clients gave us a good opportunity to explore that question more closely. They operate a hardware store on WooCommerce with a large order database and a fairly complex production environment, and their existing hosting setup was beginning to feel increasingly restrictive. Rather than recommending a platform based solely on our prior experience or relying on provider benchmarks that did not closely reflect the client’s actual workload, we decided to test the site itself.
That ultimately turned into a comparison of 12 WooCommerce hosting configurations using the same underlying production data and focusing on four areas the business considered most important: backend performance, backend order search, frontend performance, and price/performance. Inspry independently conducted the original benchmark testing in 2025, using test environments we purchased ourselves, aside from one standard free trial noted in the disclosures. In July 2026, Servebolt later sponsored an additional test of Kinsta using the same general methodology. Servebolt had no influence over the testing process, scoring, rankings, or conclusions. Because Kinsta was tested approximately one year after the original group, we identify that difference throughout the article and provide additional context in the methodology and disclosure sections below.
Across the combined dataset, the results were interesting because no single provider led every category. BigScoots produced the fastest backend and order-search results, Kinsta delivered the fastest frontend result, and Rocket.net ranked first for price/performance. Servebolt, meanwhile, finished second in all four categories, which gave it the highest overall score when each category was weighted equally.
For me, that was probably the most useful takeaway from the exercise. It reinforced something we see frequently with clients: once you are dealing with a large, operationally complex WooCommerce store, there is no single definition of “fast hosting.” The best choice depends on which parts of the workload matter most to the business.
Why I wanted to test a real WooCommerce store
A lot of hosting benchmarks are useful for what they are measuring, but the difficulty is that a fresh WordPress install or a small WooCommerce demo site does not tell me very much about what is going to happen after years of orders, subscriptions, plugins, customizations, and database growth. They are actually often tested on the opposite end with sample data and less ‘messy’ setups.
We wanted to use a clone of the real site to get into the nitty-gritty of how a real site would perform with all its flaws and imperfections. Keep in mind this is solely based on this single site so it’s anecdotal, but I do think there is value in this testing. The site we used for this test had roughly 120,000 WooCommerce orders, 15,000 active subscriptions, and a 5GB database. The original testing was performed with WordPress 6.8.1, WooCommerce 9.9, and PHP 8.3 and the plugin stack included WooCommerce Subscriptions, AutomateWoo, Wordfence, EWWW Image Optimizer, Solid Affiliate, Mailchimp for WordPress, Elementor, and a number of other plugins.
There are obviously plugins in that list that can add overhead and if the only goal had been to generate the cleanest possible benchmark result, I could have removed some of them. That was not the goal as the client explicitly needed those plugins so the hosting environment needed to deal with them.
I think this is an important distinction whenever agencies test infrastructure. We do not get to migrate the hypothetical version of the client’s site that would be easier to optimize. We have to migrate the one they actually have, including the parts we might not have chosen ourselves.
The WooCommerce hosting configurations we tested
The comparison ultimately included:
- Servebolt
- BigScoots
- Rocket.net
- Vultr with Cloudways
- Kinsta
- Convesio
- Liquid Web with xCloud
- Hivelocity with xCloud
- KnownHost with xCloud
- Vultr with xCloud
- Pressidium
- Pressable
Most of these environments were tested in July 2025. Kinsta was added in July 2026 using the same underlying production dataset, with WordPress and WooCommerce updated to the versions required at the time of testing. It therefore ran on newer application versions and hosting infrastructure than the original group. We still believe the Kinsta results are useful for comparison because the underlying WooCommerce workload and general testing methodology remained substantially the same. However, this should not be interpreted as a perfect apples-to-apples test conducted at a single point in time.
The category scores in this article are normalized across the comparison field so adding Kinsta also affects the normalized scores used in the overall Master Score. Readers should therefore view the final ranking as a combined comparison of these test results while keeping the one-year difference in testing dates in mind.
WP Engine was another provider I looked at, but the configuration recommended for a store of this size was priced significantly above the main group so I ultimately left it out of this comparison and treated it as something to evaluate separately.
I did not force every host into the same technical setup
One decision I made early in the process was that I did not want this to become a laboratory test of twelve artificially identical servers.
That might be useful if you are trying to isolate one specific infrastructure variable, but it is not really how our clients buy managed WordPress or WooCommerce hosting.
Instead, we deployed the same site to every provider and contacted the host through its normal support process, asking them to configure the environment the way they would recommend for a production WooCommerce store of this size. That meant some providers used Cloudflare or another edge layer, caching configurations differed, and the underlying architecture was not identical.
I actually consider that part of the test rather than a problem with it. If I move a client to a managed host, I am buying more than a CPU and a certain amount of RAM. I am also buying the provider’s idea of how WordPress should be configured, how caching should work, what its support team recommends, and how all of those pieces fit together.
So this benchmark is better thought of as a comparison of recommended production environments than a bare-metal comparison.
How I measured frontend performance
For the frontend testing, I used GTmetrix from Austin, Texas with desktop Chrome and tested three pages:
- Homepage
- A single product page
- My Account login page
For each of those pages, I collected Time to First Byte, Largest Contentful Paint, and Fully Loaded Time.
Austin was a deliberate choice rather than a default. The client is based in Texas and many of their customers are in Texas, so testing from Austin reflects what the store’s actual visitors experience. For the same reason, for each host we chose the geographic server location closest to Texas that was available at the time of testing.
I ran each test eight times and averaged the fastest three. The reason for doing that was to get a view of relatively stable, warmed-up performance rather than allowing one unusually slow request to define the result. It also means these numbers should not be interpreted as a measure of worst-case latency or consistency across every request which is something I cover separately in the limitations.
How I measured backend WooCommerce performance
The backend side was more interesting to me because it is frequently underrepresented in hosting comparisons and was one of the most important areas for this particular client, whose team handles a high volume of order-management work each day.
I used Query Monitor while logged into WordPress as an administrator and measured seven screens and workflows:
- WordPress Dashboard
- WooCommerce Orders
- Order search for the term “James”
- Single Order View
- WooCommerce Subscriptions
- Products List
- Single Product Edit
Again, I completed eight runs, averaging the fastest five, with the object cache cleared before the initial run. Query Monitor reports server-side page-generation time so it gave me a reasonably clean way to compare how quickly WordPress and WooCommerce were actually executing on each platform.
Why I gave order search more weight
One of the things I decided to do differently was score WooCommerce order search as a separate category even though it was already included in the broader backend average.
That means it has more influence on the final score and that was intentional.
If you have 120,000 orders and somebody on the support team is trying to find a customer while they are on the phone, a slow order search is not an abstract performance problem anymore. It is something the team experiences repeatedly throughout the day.
For this particular business, I thought that deserved more weight than simply treating it as one of seven wp-admin screens. Another store could reasonably make a different decision, but in this case the operational importance was clear enough that I wanted the scoring to reflect it.
For the search results, we kept any indexing or optimization a provider implemented as part of its initial recommended setup. Some hosts made those adjustments proactively, while others did not offer that type of tuning. Additional development work could likely improve some of these results, but the purpose here was to evaluate the out-of-the-box optimization and guidance each provider offered to a real customer rather than manually tuning every environment ourselves.
How I calculated the overall score
I ended up with four categories:
- Backend
- Order Search
- Frontend
- Price/Performance
The raw results were normalized across the field and I gave each category 25% of the final Master Score.
Master Score = 25% Backend + 25% Order Search + 25% Frontend + 25% Price/Performance
For price/performance, I averaged the backend and frontend performance scores, divided the result by monthly cost and then normalized that across the comparison group.
I am not suggesting that this is the only valid way to decide which WooCommerce host is “best.” In fact, one of the useful things about having the raw data is that another agency or store owner could weight these categories differently and get a different result.
The point was to create a scoring model that reflected the trade-offs this client actually cared about in this situation.
The overall WooCommerce hosting results
The overall rankings were:
| Rank | Configuration | Master Score | Monthly Cost |
|---|---|---|---|
| 1 | Servebolt | 80.77 | $99 |
| 2 | BigScoots | 75.87 | $334.95 |
| 3 | Rocket.net | 75.86 | $30 |
| 4 | Vultr + Cloudways | 70.31 | $270 |
| 5 | Kinsta* | 67.66 | $300 |
| 6 | Convesio | 56.77 | $300 |
| 7 | Liquid Web + xCloud | 54.45 | $137 |
| 8 | Hivelocity + xCloud | 47.37 | $129 |
| 9 | KnownHost + xCloud | 40.52 | $185 |
| 10 | Vultr + xCloud | 25.60 | $185 |
| 11 | Pressidium | 23.72 | $200 |
| 12 | Pressable | 13.22 | $25 |
*Kinsta was tested in July 2026. The remaining configurations were tested in July 2025.
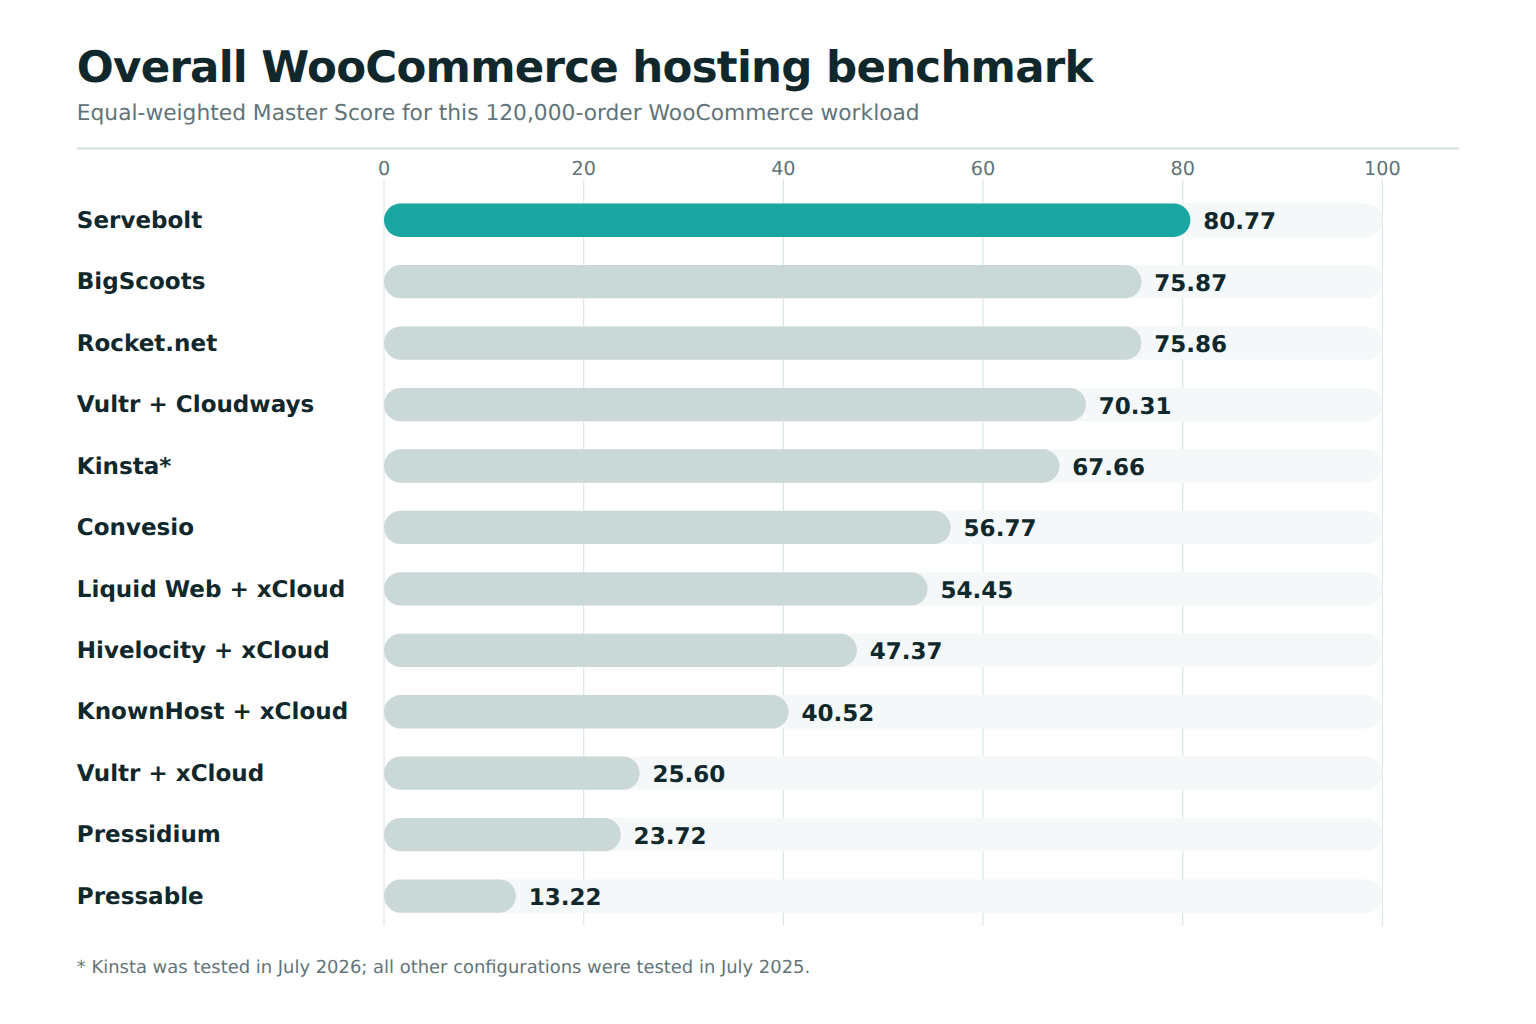
The more detailed scoring tells the story better than the overall rank by itself:
| Configuration | Backend | Search | Frontend | Price/Performance | Master Score |
|---|---|---|---|---|---|
| Servebolt | 91.83 | 97.64 | 91.26 | 42.36 | 80.77 |
| BigScoots | 100.00 | 100.00 | 90.46 | 13.02 | 75.87 |
| Rocket.net | 61.12 | 72.45 | 69.87 | 100.00 | 75.86 |
| Vultr + Cloudways | 89.16 | 97.20 | 80.50 | 14.39 | 70.31 |
| Kinsta* | 73.23 | 84.18 | 100.00 | 13.23 | 67.66 |
The full rankings and category scores are also reflected in the main benchmark.
Why Servebolt finished first without winning a category
This was probably the result that required the most explanation because people understandably expect the overall winner to have won at least one of the individual tests, but Servebolt did not.
BigScoots was first in both backend and order search. Kinsta was first on the frontend. Rocket.net was first for price/performance.
What Servebolt did instead was finish second in all four categories.
That consistency ended up mattering more in the equal-weighted score than having one or two exceptional results combined with a lower result elsewhere. BigScoots, for example, had fantastic backend numbers but its $334.95 monthly cost pulled it down to eighth in price/performance. Rocket.net’s $30 price gave it a huge advantage on price/performance, but its backend and frontend performance was further behind the leaders.
I actually like that outcome from an agency perspective because most of our clients are not asking us to solve one isolated performance metric. They need a platform where the customer-facing site is fast, the people running WooCommerce are not frustrated, database-heavy operations work well, and the price still makes sense.
Under those assumptions, Servebolt ended up with the most balanced result.
BigScoots was the fastest backend platform I tested
If I ignore cost for a moment and look only at the WordPress and WooCommerce backend, BigScoots was very clearly the leader.
Here are a few of the results:
| Admin Screen | BigScoots | Servebolt | Kinsta |
|---|---|---|---|
| Dashboard | 0.436s | 0.762s | 1.108s |
| WooCommerce Orders | 0.372s | 0.628s | 1.206s |
| Order Search: “James” | 0.744s | 1.170s | 3.604s |
| Single Order View | 0.534s | 0.626s | 1.046s |
| Subscriptions | 0.284s | 0.660s | 1.064s |
| Products List | 0.284s | 0.684s | 1.238s |
| Single Product Edit | 0.314s | 0.656s | 0.966s |
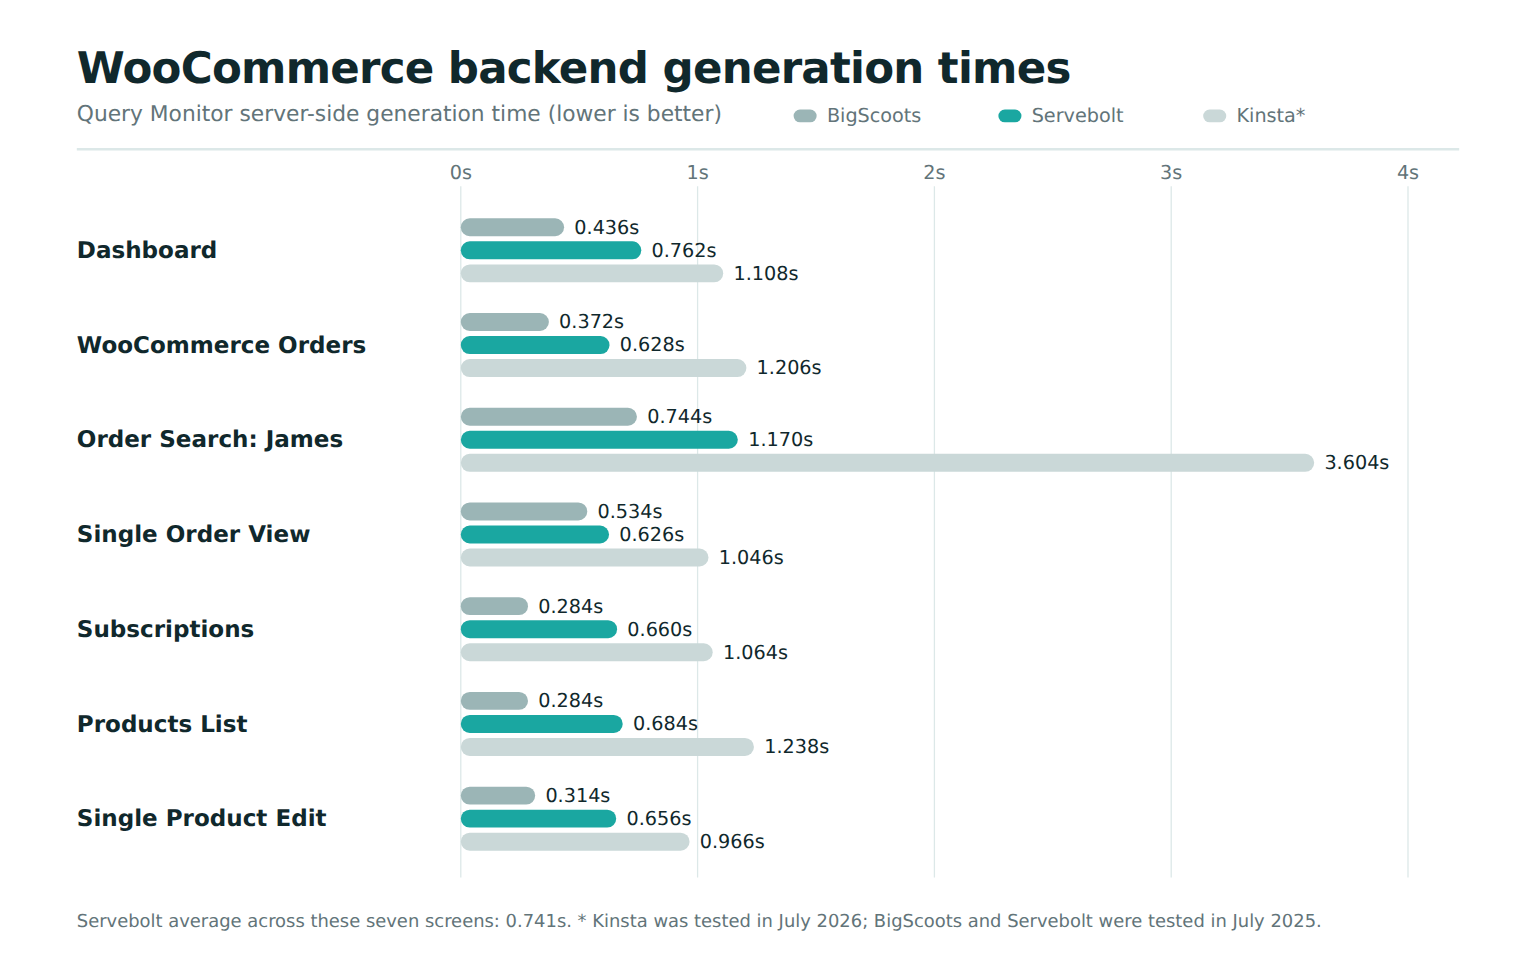
Servebolt averaged 0.741 seconds across the seven backend screens and completed six of the seven in under a second, which was also an excellent result, but BigScoots was faster on every backend screen in this group.
The difference is that the BigScoots configuration we tested cost $334.95 per month.
Whether that additional backend performance is worth nearly three and a half times the monthly price of the $99 Servebolt configuration is not something the benchmark can answer on its own. It depends on what those milliseconds are worth to the business and the return that faster operations create. The price/performance score also excludes other factors such as support, tooling, and operational requirements.
Order search created some of the largest gaps
The uncached WooCommerce order search was one of the results I found most useful because there was a very noticeable difference across the field.
Searching the approximately 120,000-order database for “James” gave us:
| Rank | Configuration | Order Search |
|---|---|---|
| 1 | BigScoots | 0.744s |
| 2 | Servebolt | 1.170s |
| 3 | Vultr + Cloudways | ~1.25s |
| 4 | Kinsta | 3.604s |
| 5 | Convesio | ~4.96s |
| 6 | Rocket.net | ~5.72s |
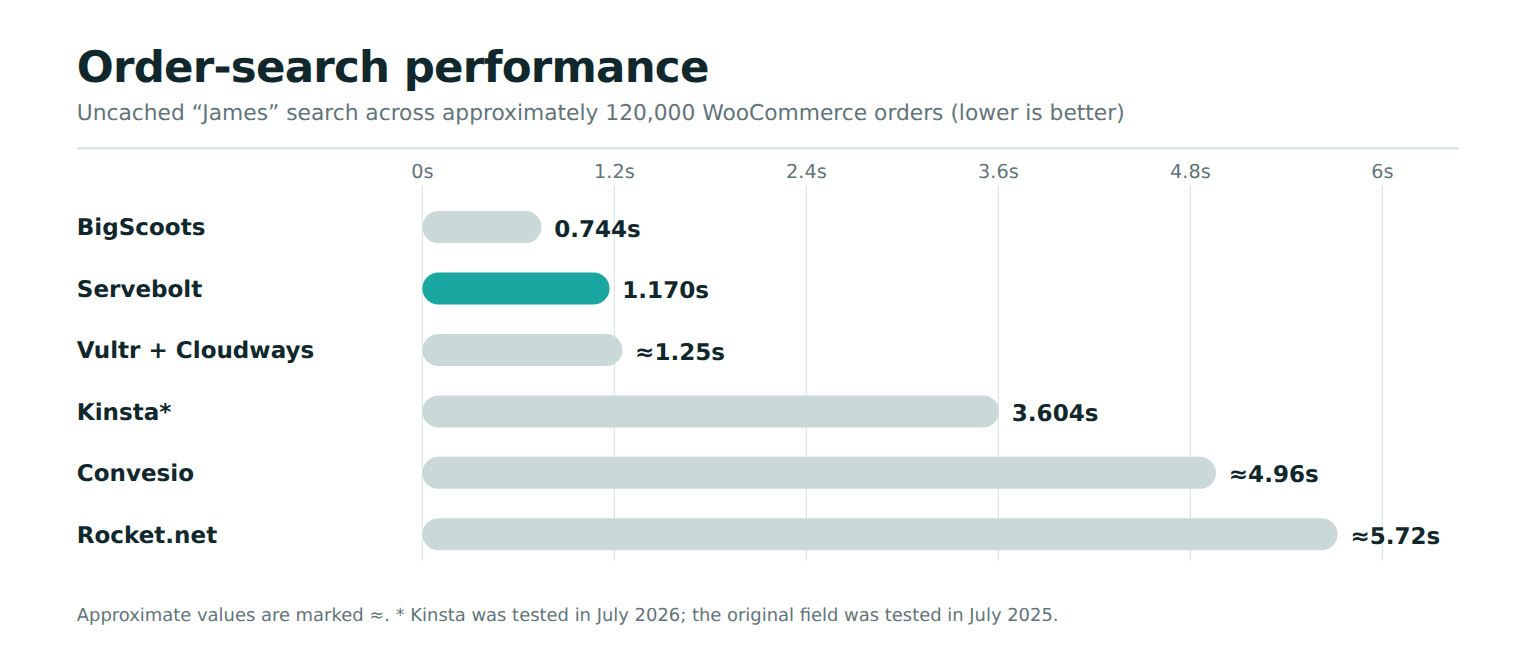
Servebolt completed that operation roughly three times faster than Kinsta and close to five times faster than Rocket.net in the recorded test, while BigScoots remained the clear leader at 0.744 seconds.
For me, this is where the difference between a hosting benchmark and a page-speed benchmark becomes obvious. If your team searches WooCommerce orders constantly, a few additional seconds can become part of the experience of running the business.
You cannot fix that with a cached homepage.
Kinsta produced the fastest frontend result
The frontend rankings were different again.
Kinsta had the fastest average result at 1.431 seconds with Servebolt at 1.626 seconds and BigScoots at 1.64 seconds.
| Rank | Configuration | Average Frontend Result |
|---|---|---|
| 1 | Kinsta* | 1.431s |
| 2 | Servebolt | 1.626s |
| 3 | BigScoots | ~1.64s |
| 4 | Vultr + Cloudways | ~1.87s |
| 5 | Pressidium | ~1.97s |
| 6 | Liquid Web + xCloud | ~2.00s |
*Kinsta was tested in July 2026.
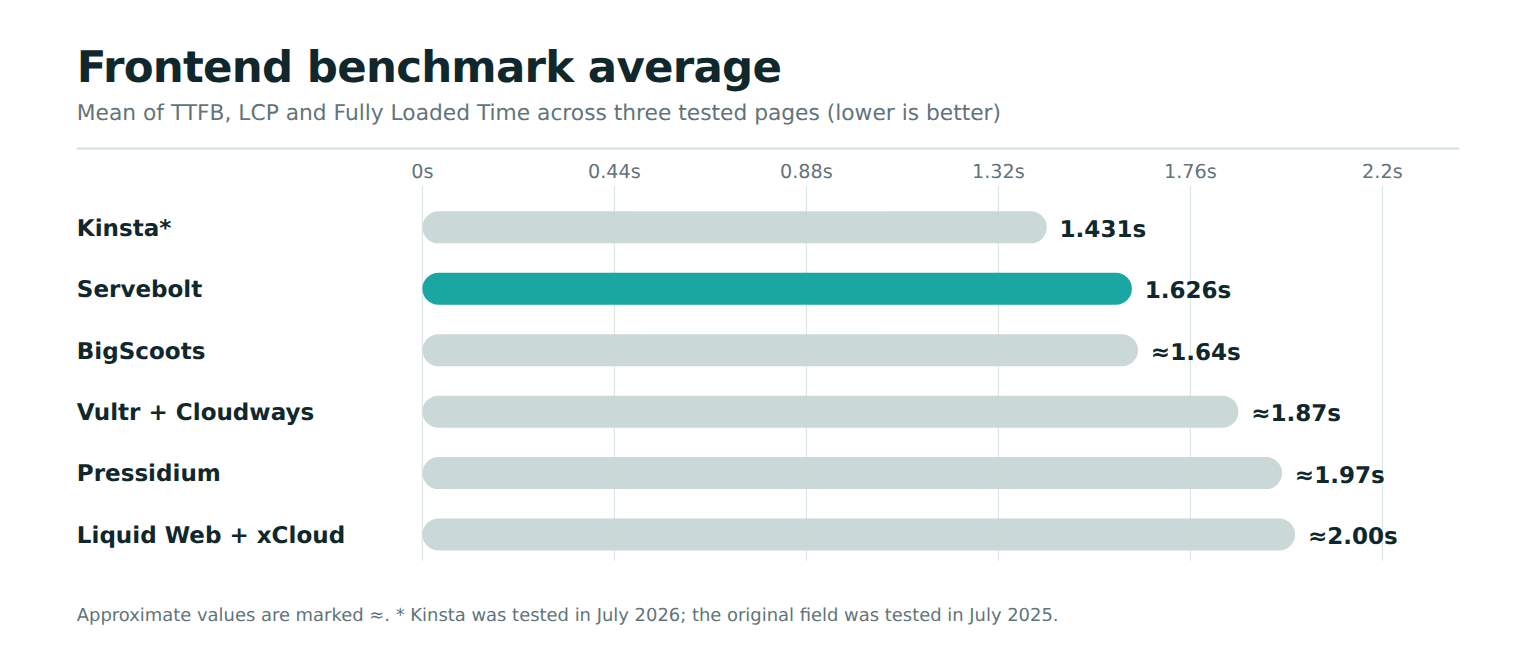
That result is one reason I would hesitate to make a hosting recommendation from either frontend or backend performance in isolation. The platforms that were strongest inside WordPress were not in exactly the same order as the platforms that produced the best public-page result.
Rocket.net was very difficult to beat on price/performance
Rocket.net is another good example of why defining the question matters.
At $30 per month, it had a very large advantage once cost was included and it finished first in the price/performance calculation despite not being among the absolute performance leaders.
| Configuration | Monthly Cost | Combined Performance | Performance per $ |
|---|---|---|---|
| Rocket.net | $30 | 65.5 | 2.183 |
| Servebolt | $99 | 91.5 | 0.925 |
| Liquid Web + xCloud | $137 | 66.4 | 0.484 |
| Hivelocity + xCloud | $129 | 54.3 | 0.421 |
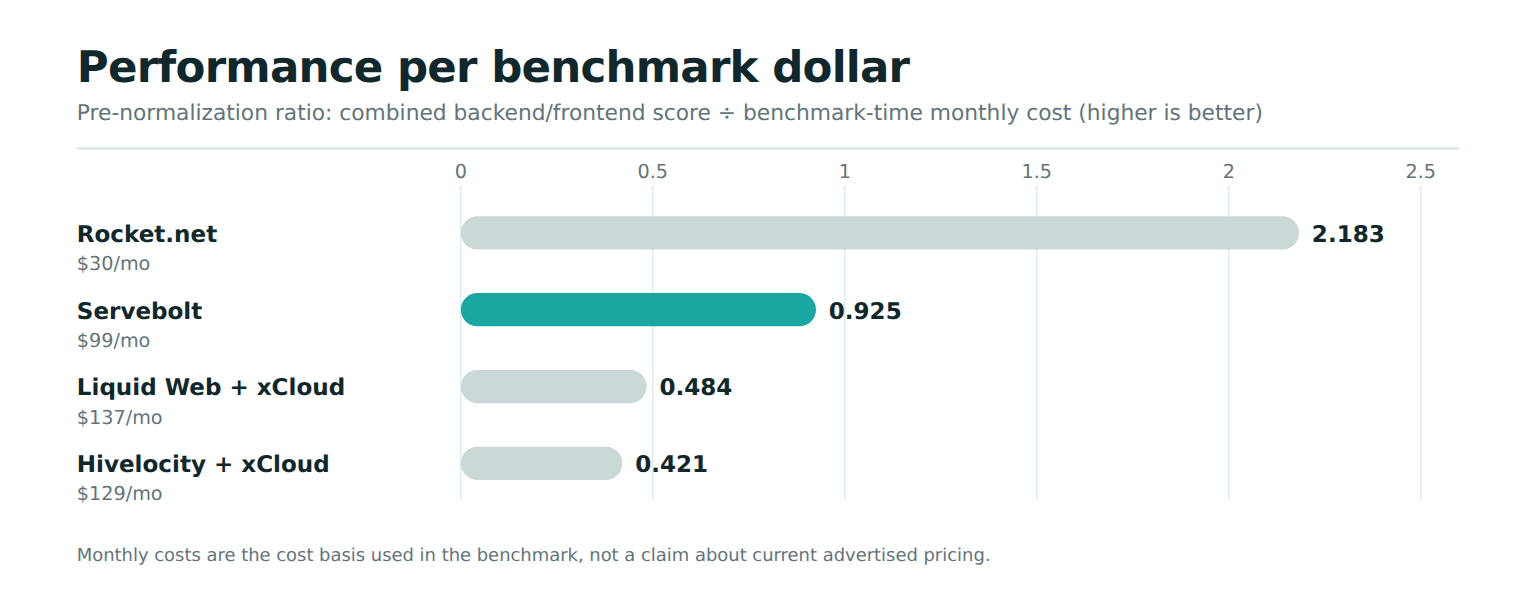
So if I were advising a smaller WooCommerce business where budget had much more weight than backend performance at this scale, I would not ignore Rocket.net simply because it did not finish first overall.
The benchmark shows that it performed very well relative to its cost.
For agencies, monthly hosting price does not tell the whole story
There is another pricing issue that becomes relevant for agencies in particular.
The $99 Servebolt Pro plan used for the calculation includes up to five sites which means that an agency using all five slots would effectively be paying $19.80 per site per month.
I would not turn that into a “cost per site” ranking, though, because that would give the impression that all twelve plans are structured the same way, and they are not.
The dedicated xCloud environments, BigScoots Business VPS, and Vultr + Cloudways can also host multiple sites on one plan while some of the managed providers are much more directly structured around site counts. The original benchmark intentionally treats $99 as Servebolt’s monthly cost rather than artificially dividing only that one plan by five.
For agencies, I think the more useful question is what the entire hosting arrangement looks like once you account for site allowances, storage, traffic, isolation, support, and how much work the agency has to do to manage the environment.
Sometimes the lowest per-site number is not the lowest operational cost.
So, which WooCommerce host would I choose?
I know this is the point where a hosting comparison is supposed to give you one name and tell you that everything else is wrong, but I do not think that would be a useful conclusion from these results.
If the primary requirement were the fastest backend and order-search performance, BigScoots would be the obvious place to start based on this test.
If the decision were dominated by frontend performance, Kinsta posted the fastest result, while keeping in mind that its testing took place a year after the original group.
If the priority were performance relative to a low monthly budget, Rocket.net did extremely well.
And if I wanted the strongest overall result for a large-database WooCommerce workload like this one, Servebolt would be my choice. It finished first overall because it remained consistently strong across backend, order search, frontend, and price/performance rather than dominating just one category.
That is a different conclusion from saying Servebolt is simply “the fastest WooCommerce host,” and I think it is a more useful one for most clients and agencies.
Speed is not the only thing you are buying
I want to be transparent about something, because it would be easy to read this and assume we move every client onto whatever finished highest.
We do not. A large share of the standard marketing and brochure sites we manage run on Pressable, which finished last in this comparison.
That is less contradictory than it sounds, because this benchmark measured one very specific workload, a 120,000-order store with 15,000 subscriptions and a 5GB database. I do not want to wave away the gaps it found, because they were not small. Across the full twelve configurations, backend averages ran from under half a second to more than four and order search from under a second to nearly nineteen. Those differences matter enormously for a store. A marketing site loads a dashboard too, but it is not loading one against 120,000 orders and that is what produced those numbers.
What often matters for those sites is the dashboard, how fast staging and cloning are, what happens when you need support at 10pm on a Friday, how site management scales across a portfolio rather than a single store and how predictable the billing is. Pressable is strong on those, which is why so much of our portfolio sits there. None of it is in the Master Score.
The same reasoning runs the other way at the top of the table. Where a client’s team lives in the WooCommerce admin all day and the budget supports it, BigScoots is often where we land because it was the fastest backend in the test and that is worth paying for even though its price put it eighth on price/performance. Where the requirement is strong performance across the whole workload rather than one dominant priority, this benchmark points at Servebolt, which finished first by never dropping out of the top two in any category.
So the conclusion I would actually give a client is not “use the winner.” Work out what the site does all day, decide which of these four categories describes that and choose on those terms. For a heavy order database with a team in wp-admin, this data is directly useful. For a marketing site, a small catalog, or a membership site, the host that finished twelfth here may well be the right answer. It all depends on your needs.
For transparency, our commercial relationships with the hosts named here, including the agency partner programs and the Servebolt sponsorship, are set out in the disclosure below.
The bigger lesson for me was not really about any one hosting company
Probably the biggest thing I took away from the process is that the value of a benchmark increases dramatically once the benchmark starts looking like the business you are actually trying to support.
If I am evaluating hosting for a WooCommerce client today, I want to know a lot more than how quickly the homepage loads.
How large is the database? How much of the site is actually cacheable? How often does the team use wp-admin? Is order search important? Are there subscriptions? Which plugins cannot be removed? What does traffic look like? Where are customers located? How many sites does the agency need to manage? What happens when the business grows?
Those questions usually tell me far more about what infrastructure the client needs than a generic “fastest WooCommerce host” ranking.
That is why this test began with a client rather than with an idea for a hosting review.
We had a real WooCommerce site with real operational constraints and needed to work out what would handle it well. Once we tested that same workload across twelve different hosting environments, the differences were much easier to see.
And for me, that is still the most useful way to evaluate hosting: start with the workload and cater to that rather than general online reviews and benchmarking.
Methodology notes and limitations
Most providers were tested in July 2025. Kinsta was added in July 2026 using the same underlying production dataset, with WordPress and WooCommerce updated to the versions required at that time.
Frontend testing was conducted through GTmetrix from Austin, Texas, chosen because the client and many of their customers are located in Texas. Eight runs were performed, with the fastest three averaged.
Backend testing used Query Monitor. Eight runs were performed with the fastest five averaged.
Order search appears both within the backend average and as a separate category because of its operational importance to this particular store.
Scores are normalized across the field, so the best result in each category scores 100 and the worst scores 0, regardless of how large the real gap is. Adding or removing a provider could change every normalized score without changing the underlying measurements.
The production configurations were not identical because each provider was allowed to use its recommended caching, server, database, and edge setup. For each host, the environment was provisioned in that provider’s server location closest to Texas available at the time of testing.
Pricing reflects the configurations used in the benchmark and can change over time.
This was a large-database application-performance benchmark rather than a concurrency or load test. We did not attempt to measure maximum simultaneous users, checkout throughput, or infrastructure saturation.
Frontend performance also reflects each provider’s recommended caching and edge-delivery configuration, so these results should be understood as comparisons of complete production environments rather than isolated origin-server performance. One additional note on Servebolt is that when we revisited the Servebolt test domain in July 2026, DNS and Servebolt API checks showed it resolving directly to origin, with neither Cloudflare nor Servebolt’s Accelerated Domains enabled at that time. Servebolt’s provisioning records confirm the same configuration was in place during the original July 2025 test.
Finally, this is one WooCommerce workload. A site with a much smaller database, HPOS configured differently, another plugin stack, greater concurrency, or different cacheability could produce a different order.
Disclosure
Inspry independently conducted the original benchmark in 2025.
Inspry participates in agency partner programs with Cloudways, Pressable, and BigScoots, some of which may provide referral compensation in other contexts. This article does not contain affiliate or referral links, and no compensation is tied to the rankings or conclusions presented here. We also maintain paid hosting accounts with Cloudways, Pressable, BigScoots, and Servebolt. In addition, our clients currently use a range of hosting providers represented in this comparison, including Cloudways, Pressable, BigScoots, Servebolt, Kinsta, Convesio, Rocket.net, and Liquid Web/Nexcess.
Servebolt provided its original test environment at no charge through a trial offered when we contacted its customer service team. Its equivalent $99 retail price was used when calculating price/performance.
Servebolt later sponsored the additional Kinsta testing conducted in July 2026. Servebolt reviewed factual information concerning its own hosting environment for accuracy but did not determine or influence the test results, scoring methodology, rankings, or conclusions.
Other than the Servebolt trial noted above, Inspry funded the original test environments. Pressidium was tested under a promotional rate, although its $200 list price was used for the price/performance calculation.
Our commercial relationships with hosting providers did not determine the methodology, rankings, or conclusions presented in this benchmark.
Looking for a WooCommerce team to help you scale?
Benchmarks tell you which host is fastest, but getting a store to perform at scale also takes the right build on top of it. Inspry develops, optimizes, and maintains high-volume WooCommerce stores, including the 120,000 order store used in this benchmark. If you want help scaling your WooCommerce store, our team is happy to talk.
Learn more about our WooCommerce development services or contact us to talk through your store.

Matt Schwartz is an accomplished entrepreneur and technology expert based in Atlanta, Georgia. He is the founder and CEO of Inspry, a WordPress and WooCommerce web development and maintenance web agency that has been providing cutting-edge technology solutions to clients since 2011. With over a decade of experience in the industry, Matt has become a respected figure in the web development community and has helped numerous businesses achieve their digital goals.